Educational reference only — not a live warning service. For alerts, follow your national meteorological, geological or civil-protection agency.

Field guide · 12 hazards · 7 science explainers

The Natural Hazard Science Guide

From the ground beneath us to the air above, this guide explains how natural hazards work. Every hazard follows the same structure so you always know whether you are reading measured science, the historical record, forecasting practice or open uncertainty.

  • Scientific fact
  • Historical record
  • Forecasting
  • Uncertainty

01 · Seismic

Earthquakes

Earthquakes happen when stress built up in rocks is released by sudden slip on a fault, sending seismic waves through the ground. Most occur along plate boundaries, though earthquakes also happen within plates.

Scientific fact

Moment magnitude (Mw) measures the size of the earthquake source; each whole step releases about 32 times more energy. Intensity scales such as Modified Mercalli describe shaking at a particular place and vary with distance and ground conditions.

Historical record

The largest instrumentally recorded earthquake struck near Valdivia, Chile, in 1960 (Mw 9.5). The 2004 Sumatra–Andaman (Mw 9.1) and 2011 Tōhoku (Mw 9.0–9.1) earthquakes generated ocean-wide tsunamis.

Forecasting

Scientists publish probabilistic hazard models and aftershock forecasts. Early-warning systems — in Japan, Mexico and on the US West Coast (ShakeAlert) — detect an earthquake already in progress and can provide seconds of notice.

Uncertainty

No method can currently predict the date, location and magnitude of a specific future earthquake. Claims of such predictions are not supported by scientific evidence.

TAP TO CREATE AN EPICENTRE
Waves spread outward from the epicentre; shaking generally weakens with distance.

Energy ratio ≈ 32× · Wave amplitude ratio ≈ 10×

Based on standard relations: energy scales by about 101.5×ΔM, recorded amplitude by 10ΔM.
02 · Volcanic

Volcanoes

Volcanoes form where molten rock (magma) reaches the surface — at subduction zones, spreading ridges and hotspots. Their behaviour ranges from gentle lava flows to violent explosive eruptions.

Scientific fact

Explosivity depends largely on magma viscosity and gas content: silica-rich magmas trap gas and tend to erupt explosively. The Volcanic Explosivity Index (VEI) runs from 0 to 8, based mainly on erupted volume and plume height.

Historical record

Tambora (1815, VEI 7) contributed to the “Year Without a Summer” of 1816. Pinatubo (1991, VEI 6) injected sulphur dioxide into the stratosphere and cooled global average temperature by roughly 0.5 °C for about a year.

Forecasting

Observatories track small earthquakes, ground deformation (GPS and satellite InSAR), gas emissions and heat. Rising unrest can lead to higher alert levels and evacuations — at Pinatubo, timely evacuations are credited with saving many thousands of lives.

Uncertainty

Unrest does not always end in eruption, and the exact timing, size and style of eruptions remain difficult to forecast.

Magma chamberConduitLayered strataAsh & gas plume
Volcano cross-section (schematic, not to scale).

03 · Atmospheric

Hurricanes, typhoons & tropical cyclones

These are the same phenomenon, named differently by ocean basin. Tropical cyclones draw energy from warm ocean water, releasing heat as water vapour condenses into towering clouds.

Scientific fact

They generally form over oceans with surface temperatures around 26.5 °C or warmer, with moist air and low vertical wind shear. Winds circulate counter-clockwise in the Northern Hemisphere and clockwise in the Southern Hemisphere.

Historical record

The 1970 Bhola cyclone in present-day Bangladesh is among the deadliest tropical cyclones recorded. The 1900 Galveston hurricane remains the deadliest natural disaster in US history.

Forecasting

Track forecasts have improved substantially over recent decades. Forecast centres publish track cones, wind-speed probabilities and storm-surge guidance several days ahead.

Uncertainty

Intensity forecasts — especially rapid intensification — remain harder than track forecasts. Storm surge and rainfall flooding depend heavily on local coastline and terrain.

EyeSpiral rainbandsEyewall
Northern Hemisphere structure. Strongest winds are usually found in the eyewall.

04 · Atmospheric

Tornadoes

A tornado is a violently rotating column of air in contact with the ground, usually beneath a thunderstorm. The strongest tornadoes typically come from supercells — storms with a persistent rotating updraft.

Scientific fact

Tornado strength is rated after the event from damage surveys, using scales such as the Enhanced Fujita (EF0–EF5) scale in the US and Canada or the International Fujita scale in parts of Europe. Doppler radar can detect rotation within storms.

Historical record

The United States records more tornadoes than any other country. The 1989 Daulatpur–Saturia tornado in Bangladesh is commonly cited as the deadliest tornado on record.

Forecasting

Forecasters identify days with favourable ingredients — moisture, instability, lift and wind shear — and issue outlooks and watches. Warnings for individual storms are typically issued minutes ahead.

Uncertainty

Many rotating storms never produce a tornado, and exact tornado paths cannot be known in advance.

RADAR SWEEP · ILLUSTRATIVE
Radar scans reveal precipitation and, via Doppler shifts, rotating winds inside storms.

05 · Hydrological

Floods & extreme rainfall

Floods occur when water overwhelms normally dry land — from rivers, intense rainfall, coastal storm surge, snowmelt, dam failure or overwhelmed drainage.

Scientific fact

Flash floods develop within minutes to a few hours of intense rain; river floods can build over days. Paved surfaces reduce infiltration and speed runoff. Atmospheric rivers can deliver prolonged heavy rain to mid-latitude coasts.

Historical record

The 1931 floods in China’s Yangtze and Huai basins are among the deadliest natural disasters recorded, though estimates of deaths vary widely. The 2022 Pakistan floods affected tens of millions of people.

Forecasting

Hydrological models combine rainfall forecasts, river gauges and soil moisture. Systems such as EFAS and GloFAS provide flood awareness days ahead.

Uncertainty

Small-scale extreme rainfall is difficult to pinpoint. A “100-year flood” means a 1% chance each year — not an event that occurs on a schedule.

LightExtreme
RAINFALL LAYERS
Layered rainfall animation; intensity colours follow a warm illustrative scale.

06 · Climatological

Wildfires

Wildfires are unplanned fires burning in vegetation. They need fuel, heat and oxygen, and their behaviour is shaped by weather, fuel conditions and terrain.

Scientific fact

Hot, dry, windy conditions and low fuel moisture raise fire danger. Fire generally spreads faster uphill. Very intense fires can generate their own weather, including pyrocumulonimbus clouds.

Historical record

Australia’s 2019–20 “Black Summer” burned vast areas of the south-east. Canada’s 2023 season burned the largest area in its modern records.

Forecasting

Fire danger systems such as the Canadian Fire Weather Index — used in many countries — translate weather into danger ratings. Satellites detect active fire hotspots.

Uncertainty

Ignitions, from lightning or human activity, are hard to anticipate, and fire spread can change quickly with shifting winds.

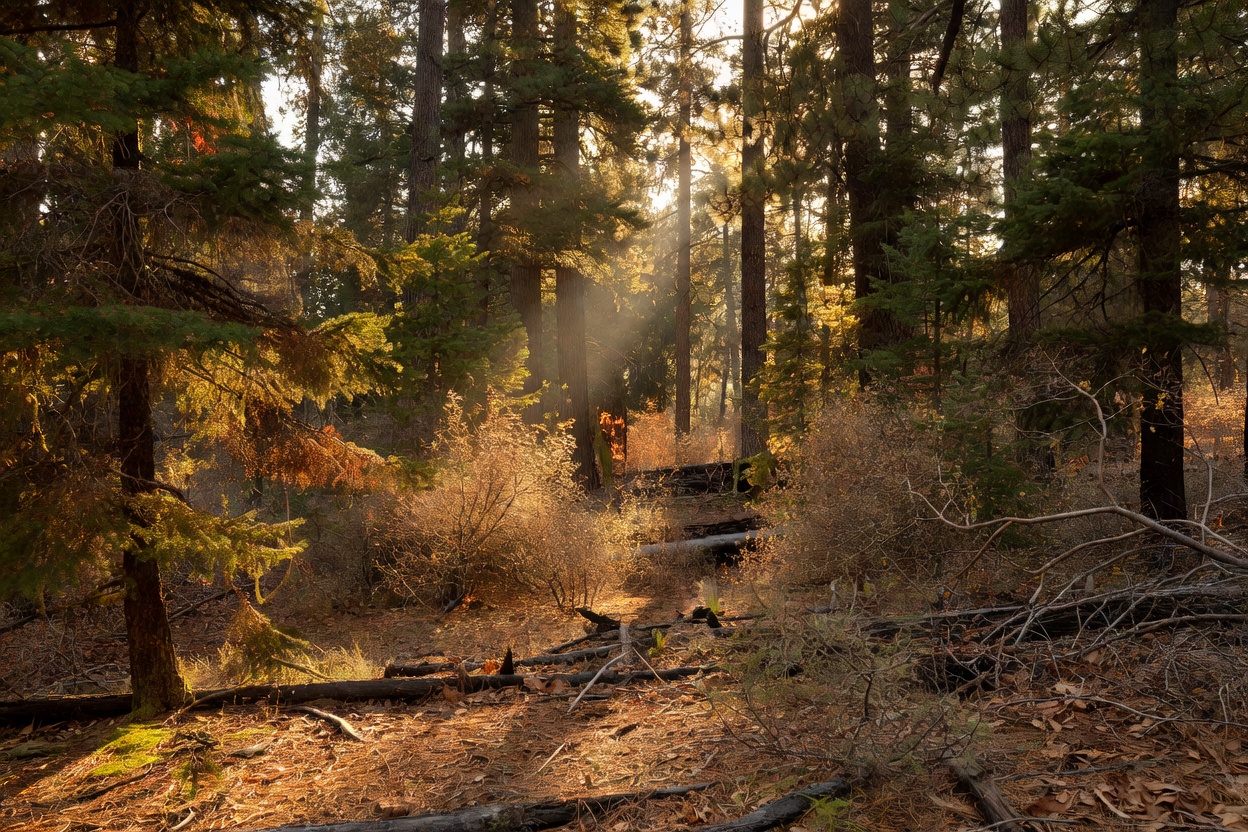
Sunlight filtering through a dense forest, illustrating the vegetation fuels that influence wildfire behaviour
Forest fuels: moisture content and density strongly influence fire behaviour.

07 · Ocean

Tsunamis

A tsunami is a series of ocean waves caused by sudden displacement of a large volume of water — most often by undersea earthquakes, but also by landslides and volcanic eruptions.

Scientific fact

In the open ocean a tsunami’s speed is roughly √(g × depth) — about 700 km/h over 4,000 m of water. Approaching shore, waves slow and grow taller (shoaling). The first wave is often not the largest.

Historical record

The 26 December 2004 Indian Ocean tsunami killed around 230,000 people across 14 countries. The 1755 Lisbon earthquake was followed by a destructive tsunami.

Forecasting

Warning centres combine seismic data, coastal tide gauges and deep-ocean DART pressure sensors; travel-time maps estimate arrival times across ocean basins.

Uncertainty

Local run-up depends on seafloor shape and coastline. Non-seismic tsunamis — such as those following the 2022 Hunga Tonga–Hunga Ha’apai eruption — are harder to forecast.

Wave speed ≈ 713 km/h · Time to cross 1,000 km ≈ 1.4 h

Shallow-water approximation v = √(g·d), g = 9.81 m/s². Real tsunamis are affected by bathymetry and wave dispersion.

08 · Atmospheric

Lightning

Lightning is a giant electrical discharge that neutralises charge separated within storms, largely through collisions between ice particles in a cloud’s mixed-phase region.

Scientific fact

A lightning channel can heat air to around 30,000 °C; its rapid expansion creates thunder. Because light outruns sound, the gap between flash and thunder estimates distance — roughly 3 seconds per kilometre.

Historical record

The WMO has certified “megaflashes” extending more than 700 km horizontally. The Lake Maracaibo region of Venezuela has one of the highest lightning flash densities on Earth.

Forecasting

Ground-based detection networks and satellite lightning mappers track flashes in real time; forecasts express the likelihood of thunderstorms rather than strike locations.

Uncertainty

Where an individual bolt will strike cannot be forecast; lightning can strike well away from the heaviest rain.

LIGHTNING · ILLUSTRATIVE
Cloud-to-ground flash animation.

09 · Climatological

Extreme heat & heatwaves

Heatwaves are prolonged periods of unusually hot weather relative to local norms. Definitions differ between countries and health agencies.

Scientific fact

Heat stress depends on humidity as well as temperature; measures include heat index and wet-bulb temperature