Volcanoes
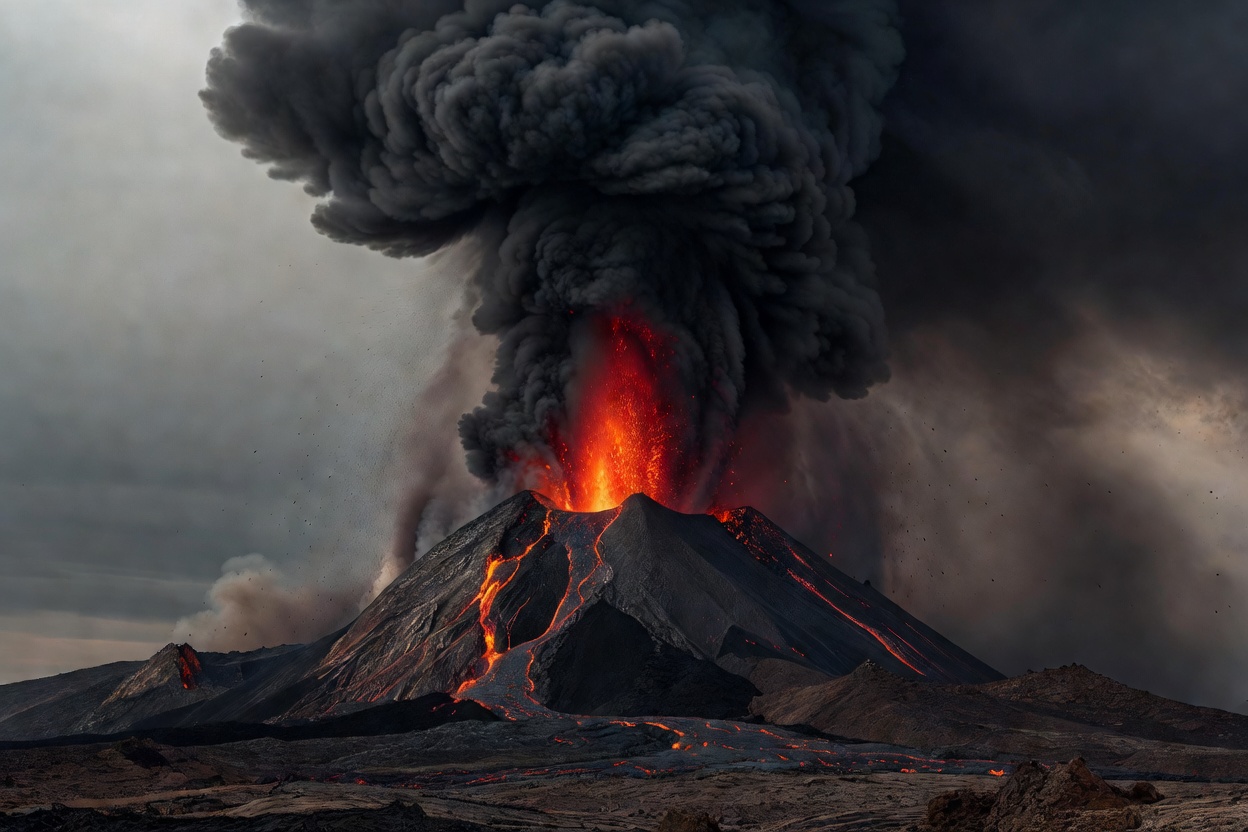
Why some volcanoes ooze and others explode
Magma viscosity and dissolved gas decide the style of an eruption. Explore our animated cross-section.
Earth Observatory · Independent science reference
Beginner-friendly guides to natural hazards and Earth science. Every explainer separates what is measured fact, what history records, what forecasters can say — and what remains uncertain.
Hazard atlas
Start with any hazard. Each guide links to its glossary terms, related hazards and the agencies that observe it.
Fault slip, seismic waves, magnitude versus intensity.
02 · VOLCANICMagma, gas and why some eruptions explode.
03 · ATMOSPHERICOcean heat engines and the forecast cone.
04 · ATMOSPHERICSupercells, rotation and damage-based ratings.
05 · HYDROLOGICALFlash floods, river floods and return periods.
06 · CLIMATOLOGICALFuel, weather, terrain and fire danger ratings.
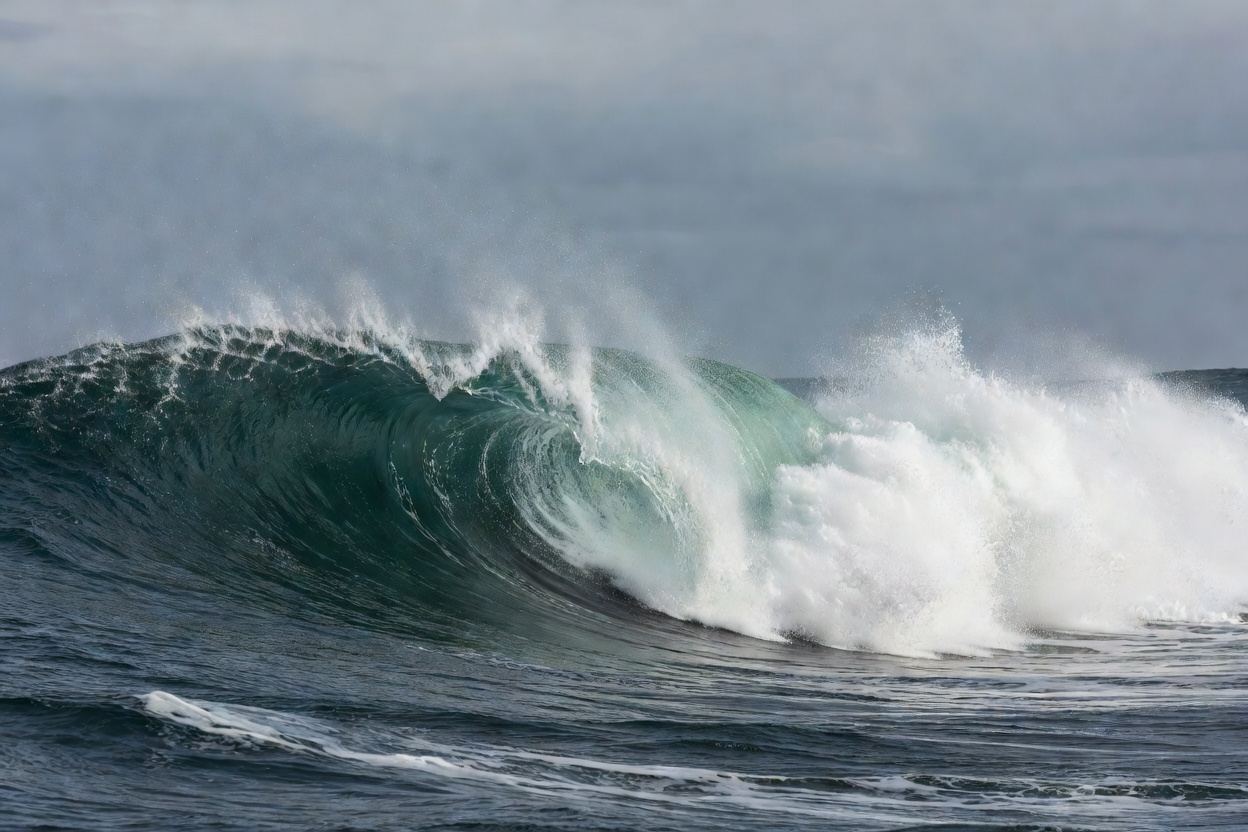
07 · OCEANSeafloor displacement and wave shoaling.
08 · ATMOSPHERICCharge separation and the physics of thunder.
09 · CLIMATOLOGICALHeat domes, humidity and heat stress.
10 · WINTERDefined by wind and visibility, not depth.
11 · SNOW & ICEWeak layers, slope angles and danger scales.
12 · CLIMATOLOGICALFour kinds of drought and how they are tracked.
Monitoring directory
Eight real, authoritative scientific services whose public data you can explore. Listings are editorial — we have no commercial relationship with any of them.
No hazards or sources match that search. Try a broader term such as “storm”, “ocean” or “satellite”, or browse the glossary.
Instrument deck
Stylised, non-live visualisations of how scientists observe hazards. None of these panels show real-time data.
Interactive model
Drag the globe (or use your arrow keys) to turn it. Glowing orange traces mark a simplified sketch of major plate boundaries — the Pacific “Ring of Fire”, the Mid-Atlantic Ridge, the East African Rift and the Himalayan collision zone.
Most of the world’s large earthquakes and many of its volcanoes cluster along these boundaries, which is why plate tectonics is the foundation of hazard science. Learn how the plates move in our tectonic plates explainer.
Model is stylised: landmasses are schematic and boundaries are approximations, not survey-grade maps.
Land (schematic) Plate boundary
Editor’s field notes
Questions readers ask
Not in the sense of naming a date, place and magnitude in advance. The USGS states that neither it nor any other scientists have ever predicted a major earthquake. Scientists can estimate the probability of shaking in a region over years or decades, forecast aftershock likelihood, and — through early-warning systems — detect an earthquake already underway and give seconds of notice. See Earthquakes.
No. Sortradarpalspatchs is an educational reference. Our visualisations are illustrative and are never live. For warnings, follow your national meteorological service, geological survey or civil-protection authority and local emergency services.
Magnitude describes the size of the earthquake source and is a single number per event. Intensity describes how strongly shaking was felt at a particular place, so it varies with distance, depth and local ground conditions. Our glossary explains both.
They are the same type of weather system — a tropical cyclone. The name depends on the ocean basin: “hurricane” in the North Atlantic and north-east Pacific, “typhoon” in the north-west Pacific, and “cyclone” in the South Pacific and Indian Ocean.
We label content as scientific fact only when it reflects established, measured physical understanding published by scientific agencies or peer-reviewed literature. Historical figures such as death tolls are labelled as records and, where estimates vary, we say so. Read our editorial standards.
Photographs are sourced from Unsplash under the Unsplash Licence. Diagrams and animations are original illustrations created for this site.